The Trading System That’s Right 96.4% of the Time

What would it be like to have a trading system that was right 96.4% of the time?
By the end of this post you will have that trading system and the amazing thing is you can implement it in under 5 minutes.
This little system done the way I am going to show you has outperformed more than 99% of all hedge funds in the world over the last 5 years.
I believe that’s something worth learning, don’t you?
So What Would It Take
What would it take for you to be right more than 90% of the time when trading?
That was the question I asked myself a long time ago- “How could I be right almost all of the time when picking market direction”?
I think it’s a question nearly all traders and investors ask themselves at least once in during their trading or investing lives.
It would mean that you would have to be on the right side of the market almost of all the time, meaning when the market was going up you were long (a buyer) and when a market was going down you were short (a seller).
I like most studied technical analysis but the problem I had with most technical analysis was it seemed to tell you exactly what the market had done after it had done it but rarely was helpful giving definite answers to telling you what it was going to do next.
And yes there were plenty of opinions on what the market might or could do, but when the dust settled all the opinions and predictions were never better than simply flipping a coin and making your decisions based off of that
Then one day I was staring at a chart looking to draw 1 of the 45 trend lines that could be drawn on the chart (again endless opinions on where and how to draw them, but again usually less successful than a coin flip).
It All Started With A Question
All I knew was when the market was going up I wanted to buy and when going down I wanted to sell and I wanted a clear cut answer without all the usual 50 different ways to interpret the chart.
I wanted one way and I wanted that way to be rock solid in its results and simple in its execution and from that question was born the answer I now call Trade The Line.
Yep that was my answer to my question simply draw a line- could it be that simple?
Could being a successful trader be as simple as drawing a line?
The answer is YES!
Now I know that all the hardcore technical analysis people must be screaming No, No, No. Well let me assure you it’s YES, YES, YES.
I will save the 97 reasons I could give you and the research to prove it, but better I get to showing you how this works so you can start using it.
Q. So what line is it you draw exactly?
A. A straight one.
Like in the image below.

So Whats So Special About A Line
What’s so special about that line you may be asking. And the answer is everything is special about that line.
It gives you back the power as a trader.
No more trying to interpret endless indicators or trend lines, you simply have one line and when the market goes above that line you buy and when it goes below it you sell.
What does that mean for you? It means that you will ultimately be right on market direction 100% of the time. Yes periodically you may be incorrect but if you follow what I have just offered you, you cannot help but be right 100% of the time with market direction.
There’s no second guessing or wondering. It’s as simple as if the market goes above the line you buy and if the market goes below it you sell and through default, if you like you are ultimately right 100% of the time with market direction.
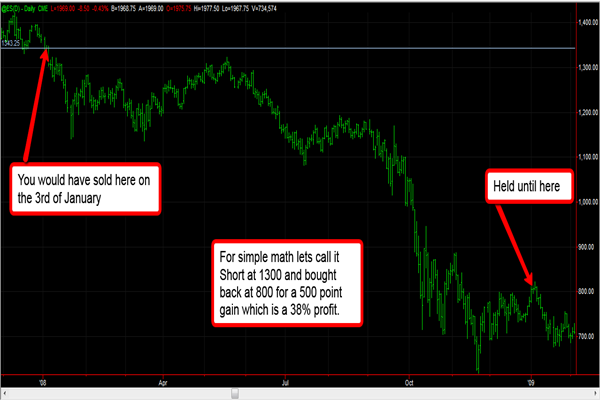
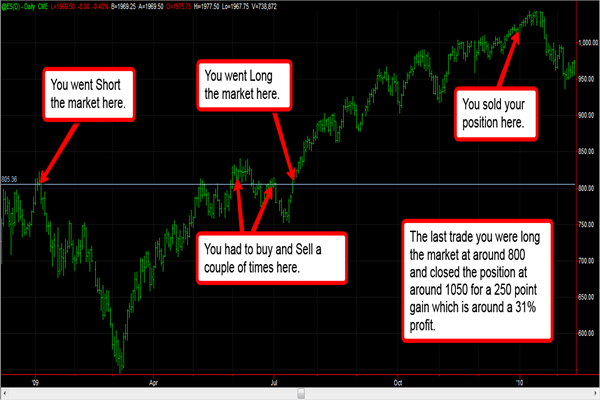
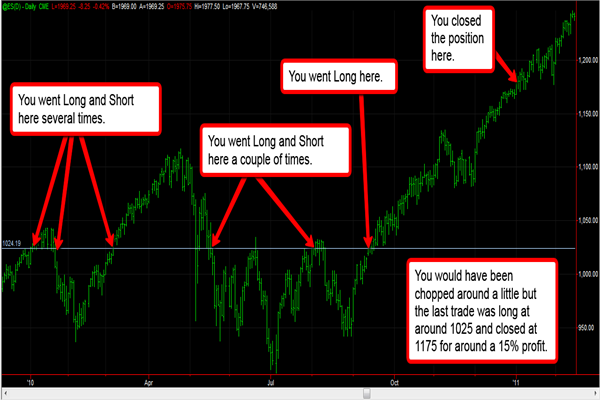
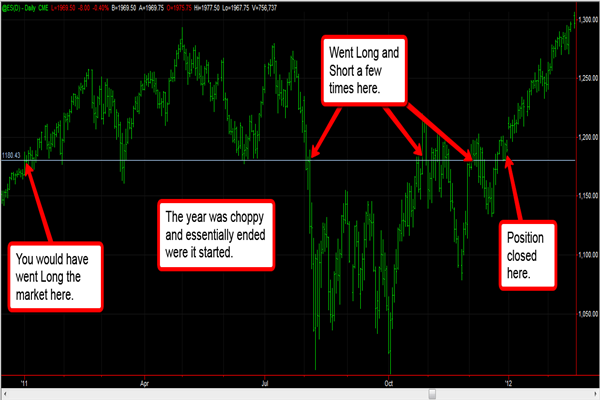
For the examples I have simply decided to draw the line at the 1st available trading day of the New Year and if the market goes above that line I will buy it and if it goes below that line I will sell it.
I will close out the open position at the end of each year and redraw the line for the New Year starting and repeat this process each year.
Here are some examples.
2008 to 2009
2009 to 2010
2010 to 2011
2011 to 2012
2012 to 2013
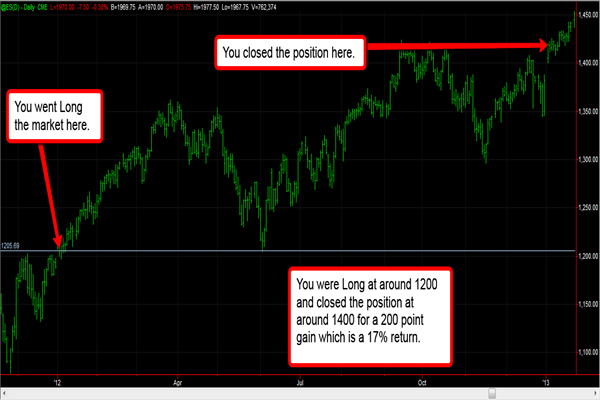
2013 to 2014

Are the examples over simplistic? Somewhat yes but that’s by design. All I am trying to do here is demonstrate the mechanics of the strategy. There are 14 other things that can be applied to significantly enhance the returns when using this strategy.
I think it’s a fair example considering I picked the S&P500 as a test. The likelihood of me using the S&P500 with the strategy are slim to none as there are so many better choices out there.
Choices that could more than triple the returns of what the S&p500 got over that period.
Let’s take a look at some of the positives for a moment.
Were you ever worried about market direction? NO because you were always on the right side of the market.
How long does it take to implement? About 5 minutes once a year and then you simple set up some alerts to inform you of any adjustments that may be required and as you saw some years there were none.
200% Return On A Market I Wouldn’t Even Use
The example I gave made over 200% compounded for the test period-not too shabby.
When was the last time your money manager got you those types of returns?
It’s also a very peaceful way to trade and you are always in control you know exactly what to do and when to do it.
It’s very liberating.
Not to mention how easy it is to implement.
Now there are many ways you can enhance the Trade The Line concept that would allow you to increase the ROI significantly but I will save that for future posts, if enough interest is shown in this one.
Check Out The Video
I have also created a short video that shows you how I set up the Trade The Line strategy and some extra tips on how to go about it.
As always we would love to hear from you, so please comment below.
Remember to tell your friends about this page if you found it useful.
